
Analysts' Insights

Bitcoin Breakout Imminent as Macro Data Signals Strength
- by Markus Thielen
Two months ago, U.S. inflation (CPI) rose unexpectedly from 3.2% to 3.7% YoY. This rise broke the relentless decline in inflation, which may explain why Bitcoin traded in a relatively uneventful range of $25,000 to $26,000 during the late summer.
As our readers are aware, since November 2022, the decline in inflation has been a massive tailwind for macro-liquidity, and it’s a key reason why Bitcoin prices have surged by over +113% this year. A month ago, U.S. inflation remained pinned at 3.7%. As traders became more comfortable with this level and perceived it as a temporary increase, Bitcoin prices rose from $27,000 to $34,000 a week after the release of the inflation data.
Other factors may have been at play as well, such as the short-gamma of Bitcoin option market makers or the positive statistics related to buying Bitcoin on ‘unlucky’ Friday the 13th. However, as we've demonstrated numerous times, a decrease in inflation data triggered a rally in Bitcoin prices earlier this year. Crude oil prices rallied by +30% from their summer low, which could have impacted inflation expectations. Nevertheless, since late September, oil prices have declined by -20%. Traders are likely anticipating another decline in inflation, which supports risk assets from a macro-liquidity perspective.
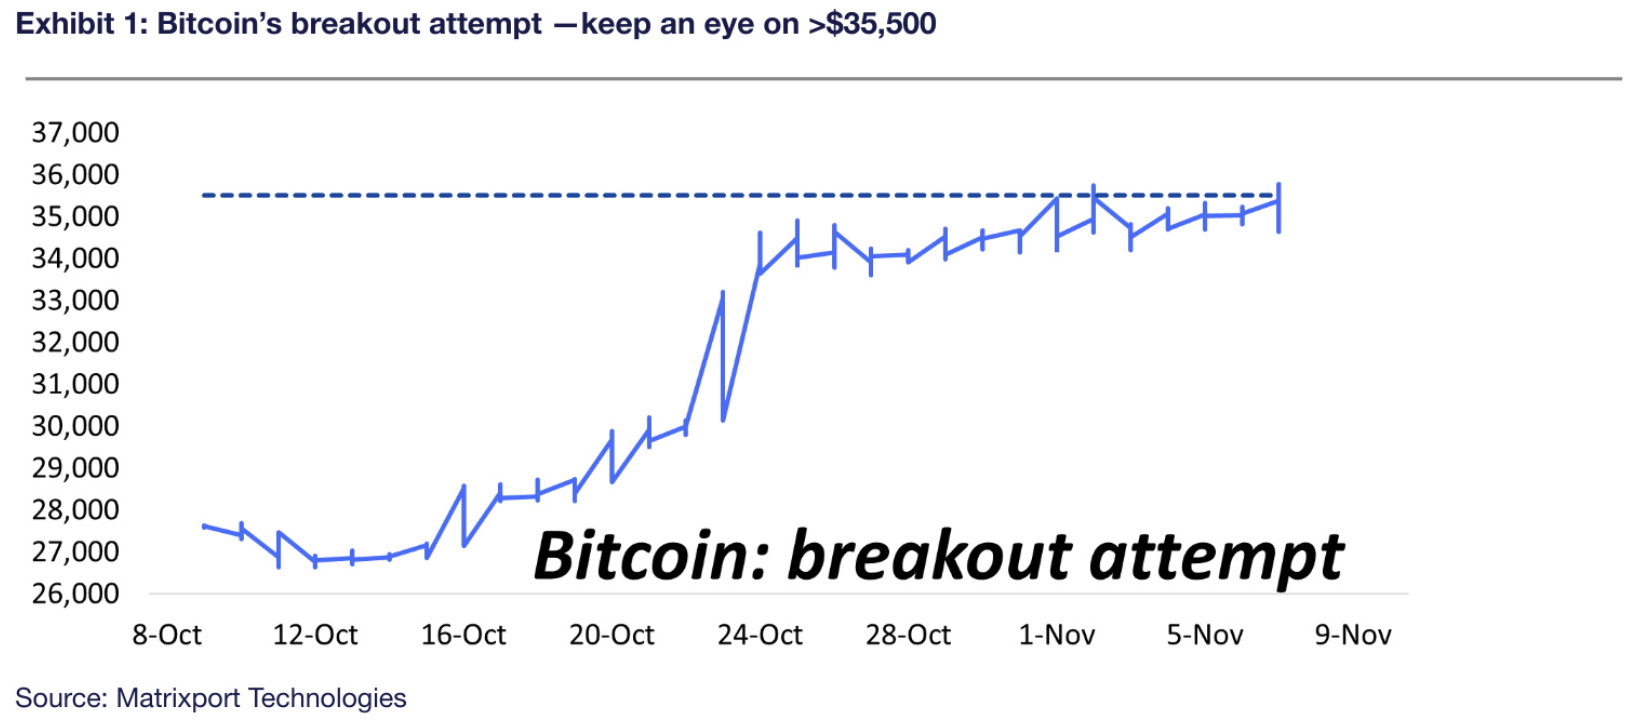
Next week’s U.S. CPI data could trigger another rally in Bitcoin if inflation declines again. Ahead of this data release, we can see Bitcoin attempting to break out from its recent $34,000 - $35,000 trading range. A break above $36,000 could propel Bitcoin toward our next technical resistance level at $40,000, potentially reaching $45,000 by the end of 2023.
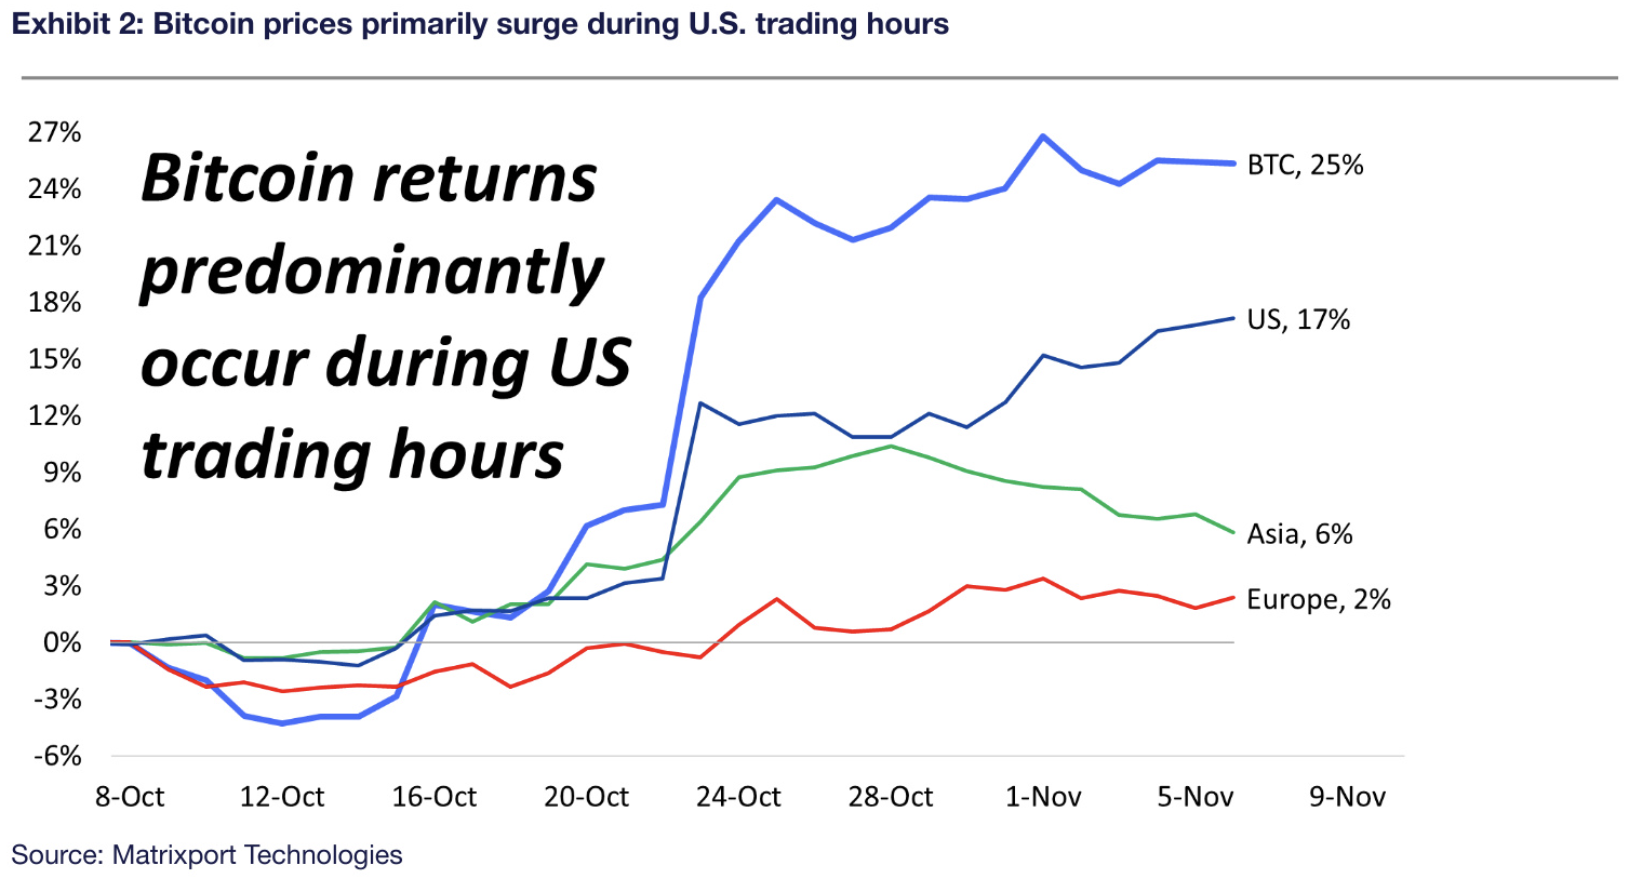
Trading Patterns: Steady U.S. Bitcoin Buying Activity
Notably, consistent and gradual buying activity has been observed during U.S. hours, even as Bitcoin has experienced declines during Asian trading hours. One possible explanation is that Asian traders are favouring Altcoins over Bitcoin.
However, while Ethereum has seen a +16% increase, it’s noteworthy that 70% of these returns (equivalent to +11%) occurred during U.S. trading hours. Solana, on the other hand, maintains a more balanced performance across all three regions. This is surprising, given that flows from Europe are relatively insignificant compared to the volumes seen during U.S. and Asian trading hours. The evenly distributed flows can be attributed to the Solana Breakout Conference in Europe (Amsterdam).
Last week, three ‘macro bullish’ data points emerged: 1) the U.S. Treasury Department slowing the pace of issuing longer-dated debt, which indicates that bond yields should decline; 2) Chair Powell’s dovish stance during the post-FOMC meeting press conference, indicating that the Fed is unlikely to hike interest rates again during the cycle; 3) Disappointing U.S. employment data, reinforcing the first two points.
The next crucial macro data point will be the U.S. CPI (inflation) data, scheduled for release next Tuesday, November 14th. With a steady increase in buyers during U.S. trading hours and an ongoing attempt for Bitcoin to break out, we could see prices rallying into the end of the month (and year). The Santa Claus rally could start at any moment.
Written by Markus Thielen, Head of Research & Strategy at Matrixport. Author of Crypto Titans.
Join now for more insights around crypto!

Industry views and information shared do not represent Matrixport's position and do not constitute any investment advice.
