
Analysts' Insights

Last week, we were bearish Bitcoin, this week...
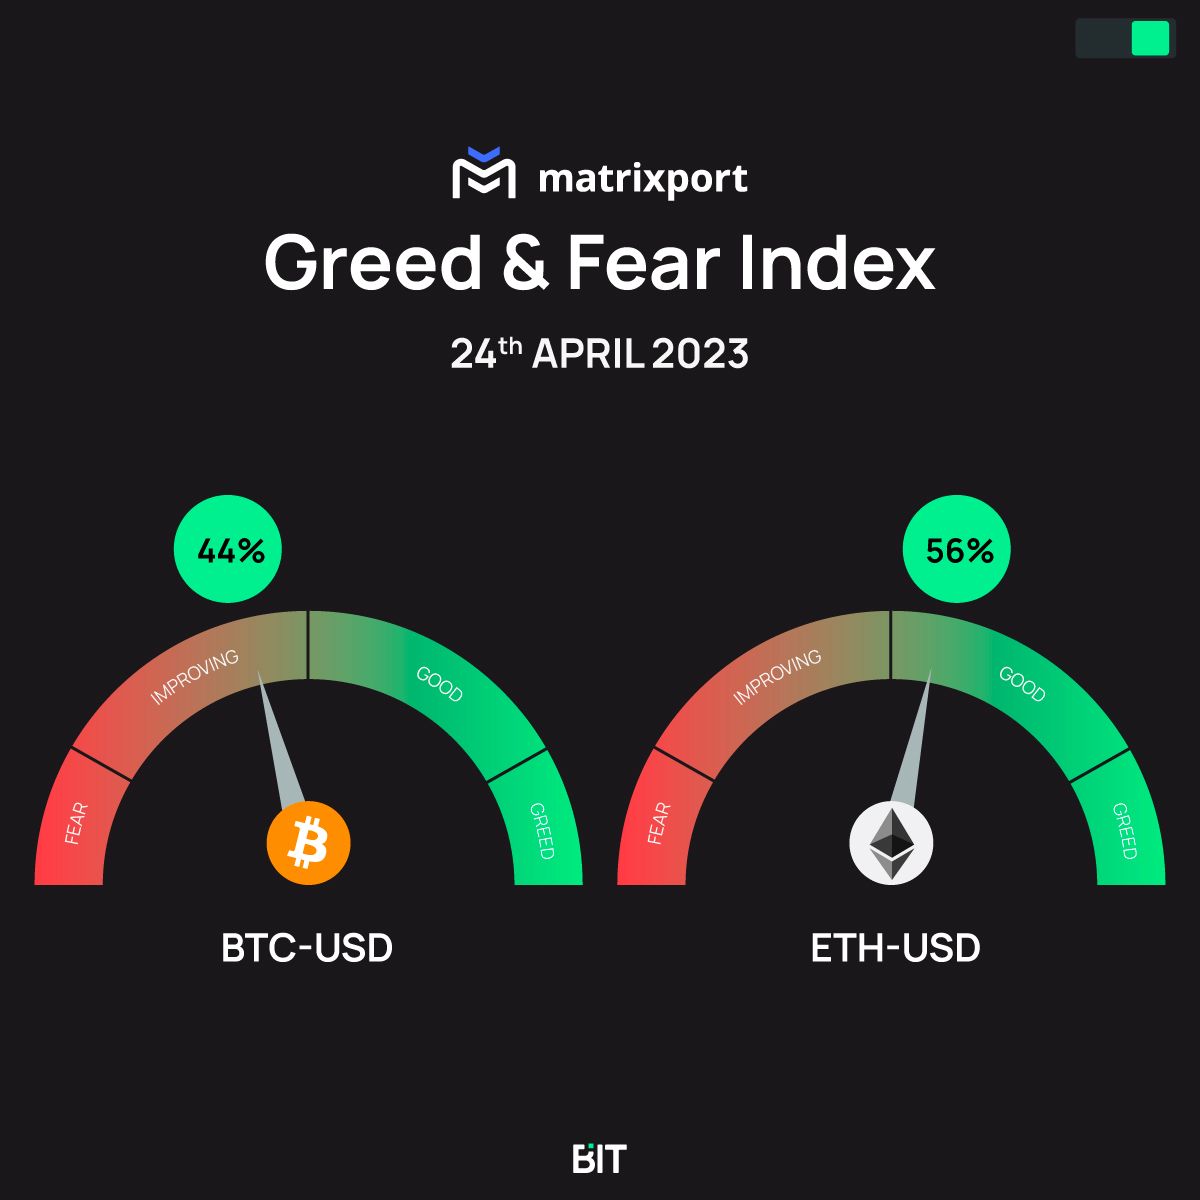
- We urged readers to cut crypto long positions a week ago as sentiment was exuberant (Bitcoin @ 30,350 & Ethereum at 2,127). Our Bitcoin Greed & Fear index has now dropped back to 44 (for Ethereum 46), from near 100 max readings. We could see lower levels soon, but buying half a position here at 27,500 is not a bad re-entry level. Bitcoin prices might even drop back to 25,000 – where we would buy the second-half position.
- There are two big issues right now: 1) this will likely be the last week where USDC is above $30bn as the outflows continue, but BUSD has also dropped to $6.5bn. This relentless decline in stablecoin market cap signals that money leaves the ecosystem with some (positive) spillover effect into USDT and Bitcoin. 2) the funding rate for Binance BNB is deeply negative – as if some negative news will be released soon. Open interest is low (for now), so we are keeping an eye on this.
- Bitcoin price is 27,519 above the 50d MA 26,944 -> this is bullish, price WoW decreased by -9.2%; Ethereum price is 1,857 above the 50d MA 1,802 -> this is bullish, price WoW decreased by -11.3%; overall the trend is up -> bullish.
- Ethereum outperforms Bitcoin currently as the trend (20d) MA shows ETH / BTC ratio is going up; crypto is driven by alpha factors, this is positive, find idiosyncratic trades.
- The Global Crypto market cap decreased by -7.7% WoW to $1.21trn, above the 50d MA ($1.2trn), which is bullish, Bitcoin dominance at 44% for the week (above the 50d MA 43.5% -> as alt coins underperforming), this is bearish.
- Global Crypto trading volume decreased by -35.7% WoW to $50.9bn, below the 50d MA ($79.2bn), which is neutral, weekly Bitcoin volume was -43% lower than avg. while Ethereum volume was -1% lower than average.
- Top 3 stablecoin mkt cap ($118.8bn) is in the 0%ile range, volume ($22.5bn) is in the 3%ile range (last 3m), Mkt cap WoW -2% or $-2.4bn, is normally a bullish sign for 'risk-on' liquidity (as USDC mkt cap down while USDT mkt cap up), but liquidity is leaving the eco-system, which is negative.
- The number of active Bitcoin addresses has increased by 6.8% over the last 1 week, to 843k, this is bullish, number of active Ethereum addresses has decreased by -28.9% over the last 1 week, to 491k, this is bearish.
- The futures funding rate trades positive for Bitcoin (1.8%) and the funding rate is negative for Ethereum (-3.6%), interestingly, there were hardly any liquidations, despite a -10% decline in prices.
- Our Greed & Fear Index prints 44%, while the Ethereum Greed & Fear Index prints 56%. The RSI for Bitcoin is 43% while the Ethereum RSI is at 49%.
Join BIT’s Premium channel for more insights into crypto!
