
What are Trend Lines in Crypto Technical Analysis?

Since the cryptocurrency market is highly volatile, it is essential to have a strategy for controlling trades. It is vital for any individual going into cryptocurrency trading to conduct a technical analysis to obtain consistent results. The technical analysis is to create an insight into the previous movements of cryptocurrency, which helps crypto traders predict where the crypto market will head in the future.
Crypto trading is not a gamble where you just buy or sell based on guessing or intuition. One of the essential things crypto traders need to do to get adequate information about what is happening in the market is technical analysis.
What is Technical Analysis?
Technical analysis uses mathematical indicators to compute statistical trends to forecast the price movement in the crypto market. This is achieved by comparing the past price changes and volume data to understand how the market works and predict how it will affect the difference in price for subsequent trades.
What Are Trend Lines?
As the name implies, trend lines are typically used in technical analysis to determine the order or movement of a trend. These lines are drawn along the end of the direction and are used in joining data points which helps specific crypto traders and chartists see crypto price movements and determine market trends.
If prices are towering high, the trend line will be slanted upward. Likewise, the trendline slows downward when there is a consistent price fall.
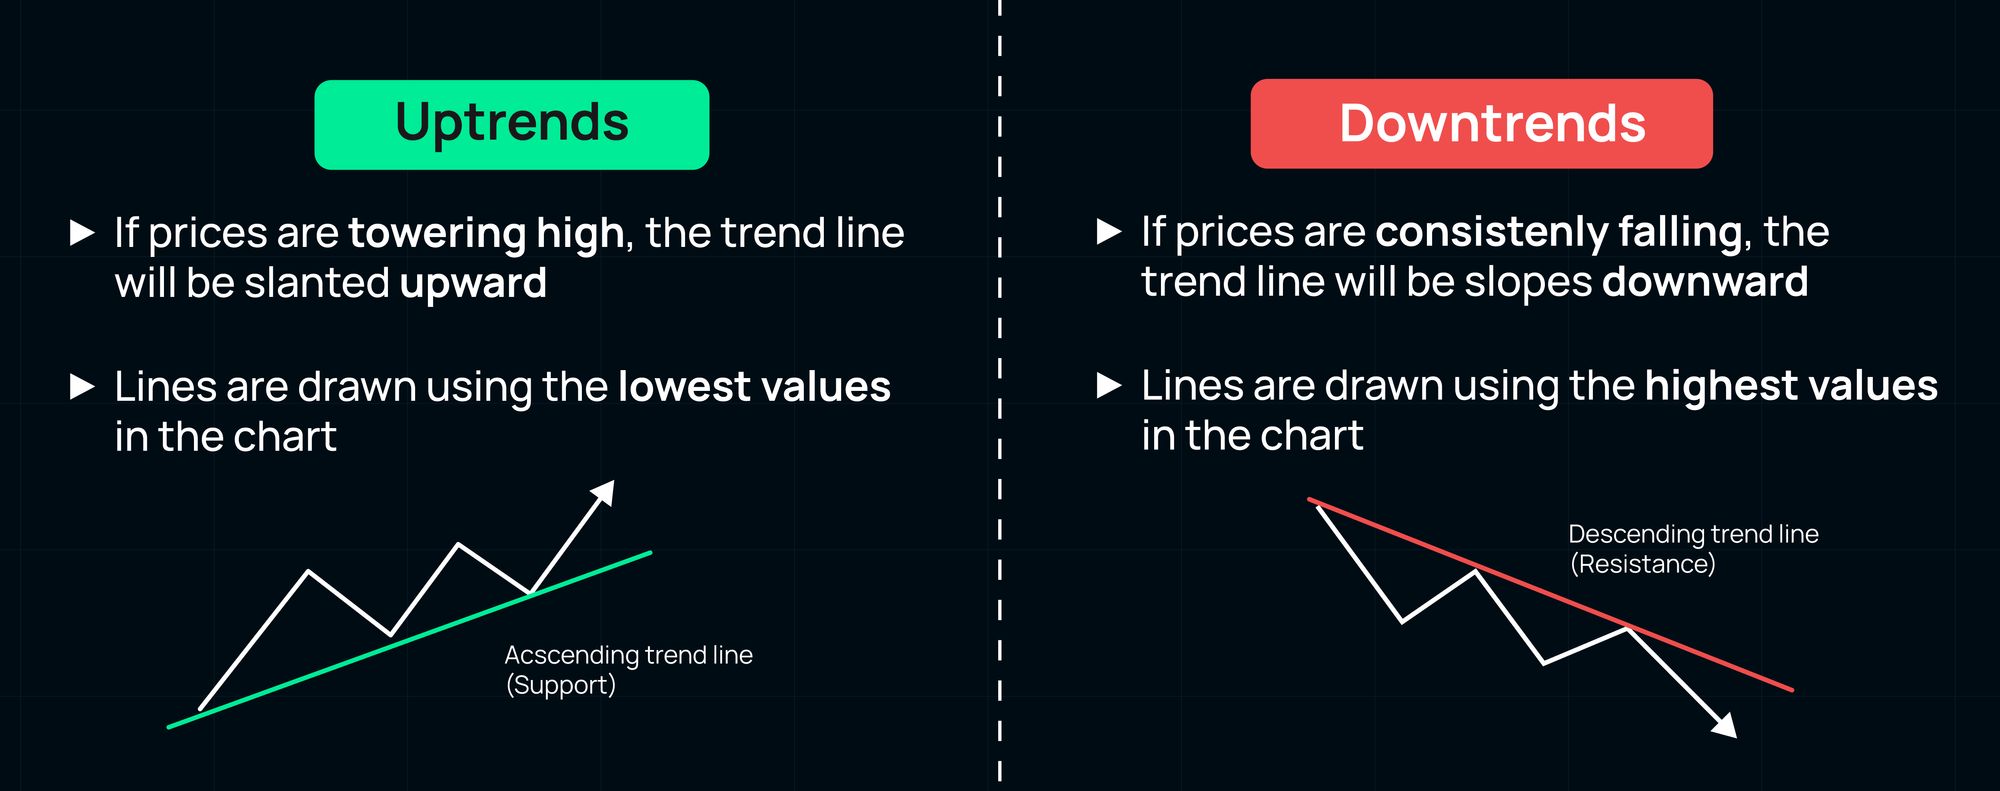
The significant difference between the two lines is the choice of the points used in drawing them. For an uptrend, lines are drawn using the lowest part in the chart, while in a downtrend, lines are drawn using the highest values.
Things to put into consideration while drawing Trendlines
In addition to drawing trend lines, other things can affect the crypto trend as time passes. Instead, crypto traders must look into some factors before starting a trade. These factors include the time frame and trading volume:
- Time frame:
The crypto market is not steady. The pattern a crypto trader identifies in the long term can be achieved in a shorter period. Signals produced on shorter-term time frames have less reliability. It is so because no data is moving into the creation of each price bar. This indicates that minute charts have lesser weight, favoring the more significant trends.
How to draw Trend lines on Crypto Charts
The drawing of trend lines on crypto charts can be explained using two significant examples. The first example discusses how to draw trend lines moving upwards - uptrend lines, while the second example concerns how to draw trend lines moving downwards - downtrend lines.
- Uptrends
Drawing trend lines is easy if you know how and where to start.
Firstly, you locate two or three common low points on an uptrend line. The main work is to create a succession of higher lows. After spotting these low points, charting software activates the trend line drawing tool. Next, click the lowest part of the trend. After that, click on the second lowest point.
It is possible that the trend lines don't stretch further. In this case, you must activate your settings to allow the line extension to the right. After setting the ascending trend lines, you must ensure the lines are not moving through the outer part of the candle wicks.
2. Downtrends
Unlike uptrends, the direction of downtrends is always downwards. Descending trend lines are primarily associated with down-trending markets. Firstly, you locate any crypto market experiencing a price fall.
Secondly, you locate two or three similar high points within this correction, showing a series of lower highs. Lastly, the trend line drawing tool is activated on the chart. Click at the leftmost highpoint, then click the right to finish the line.
Importance of Trendlines
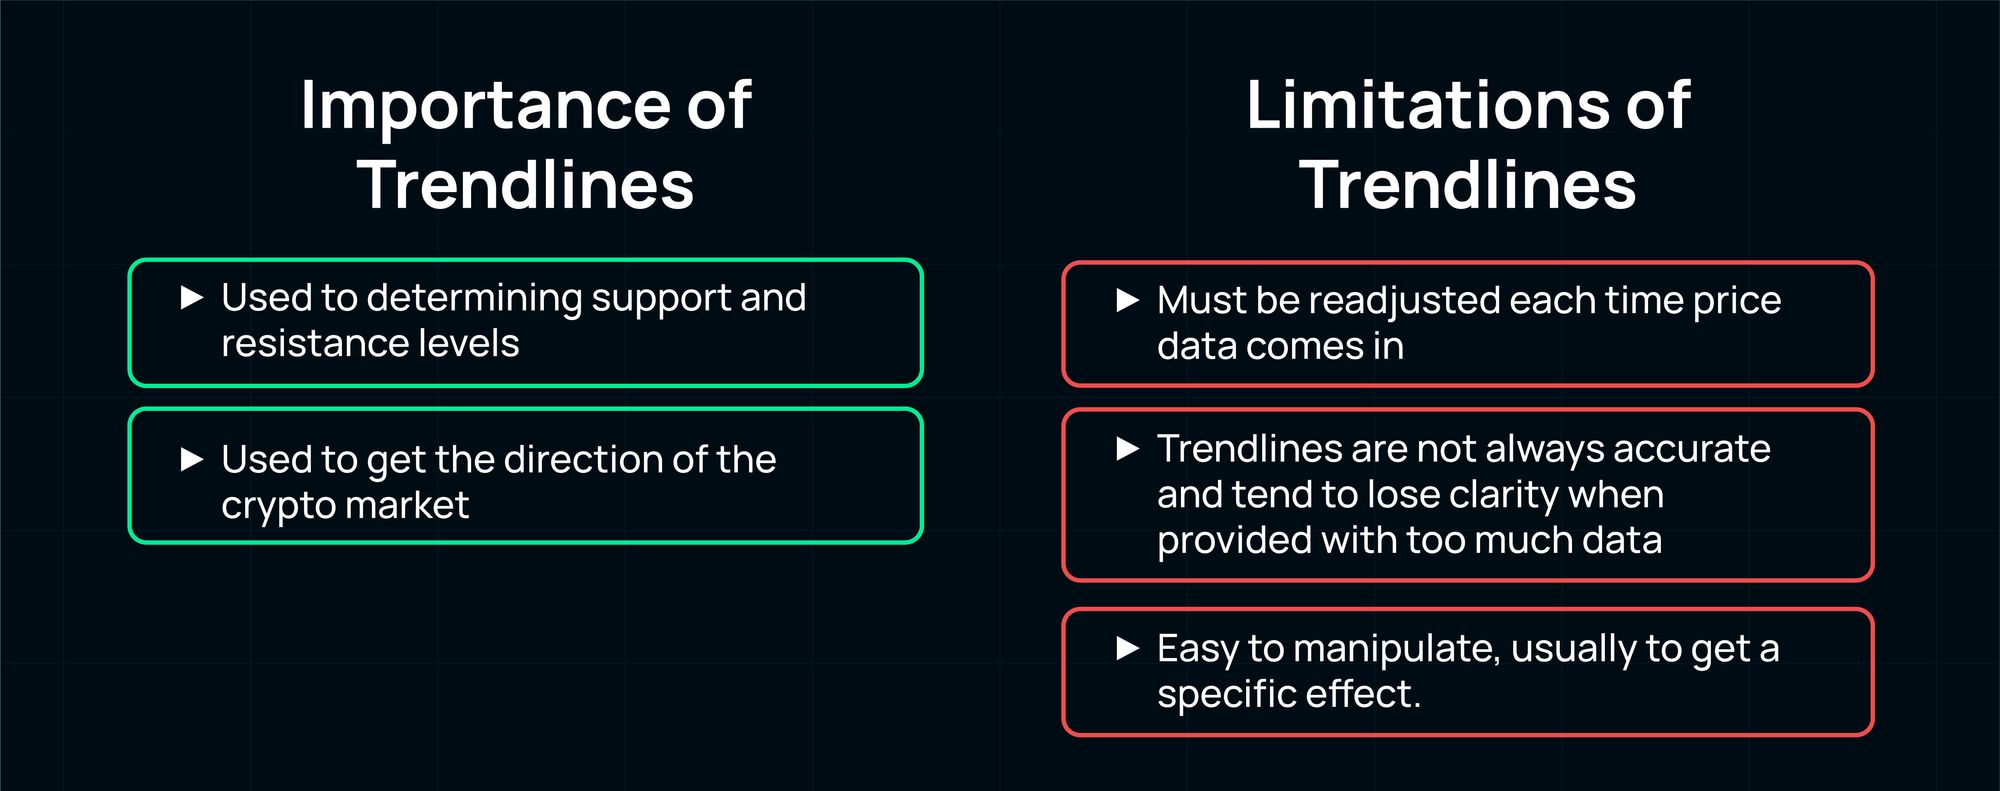
- Trend Lines are used to determining support and resistance levels. For support, crypto traders are expected to stop selling, and buyers will buy. Resistance at the top of the chart is holding do, buyers are expected to stop buying, and crypto traders begin to emerge.
- It is used to get the direction of the crypto market.
Limitation of Trendlines
- Like every other chart, trendlines have limitations in that they must be readjusted each time price data comes in. Although trendlines sometimes last longer, the crypto price will eventually change at some point, and it will need to be altered or updated.
- Trendlines are not always accurate and tend to lose clarity when provided with too much data.
- They are easy to manipulate, usually to get a specific effect.
Closing Thoughts
Trend lines are among the most straightforward and essential tools for identifying trading opportunities, and trend lines can be quickly implemented and easily learned. All crypto traders must learn how to read cryptocurrency charts with trend lines, which will help traders grasp the crypto price movement.
Crypto traders can use trend lines to identify opportunities in a bull or bear market opportunities within any chart time frame. However, be mindful that signals generated on minute charts are more likely to be false due to the smaller amount of data they contain.
Trade Crypto on Bit.com
With the mission to create an entire ecosystem for blockchain-based financial transactions, Bit.com stands as the world’s 2nd largest crypto options exchange.
Sign up on Bit.com, and switch on your future.
